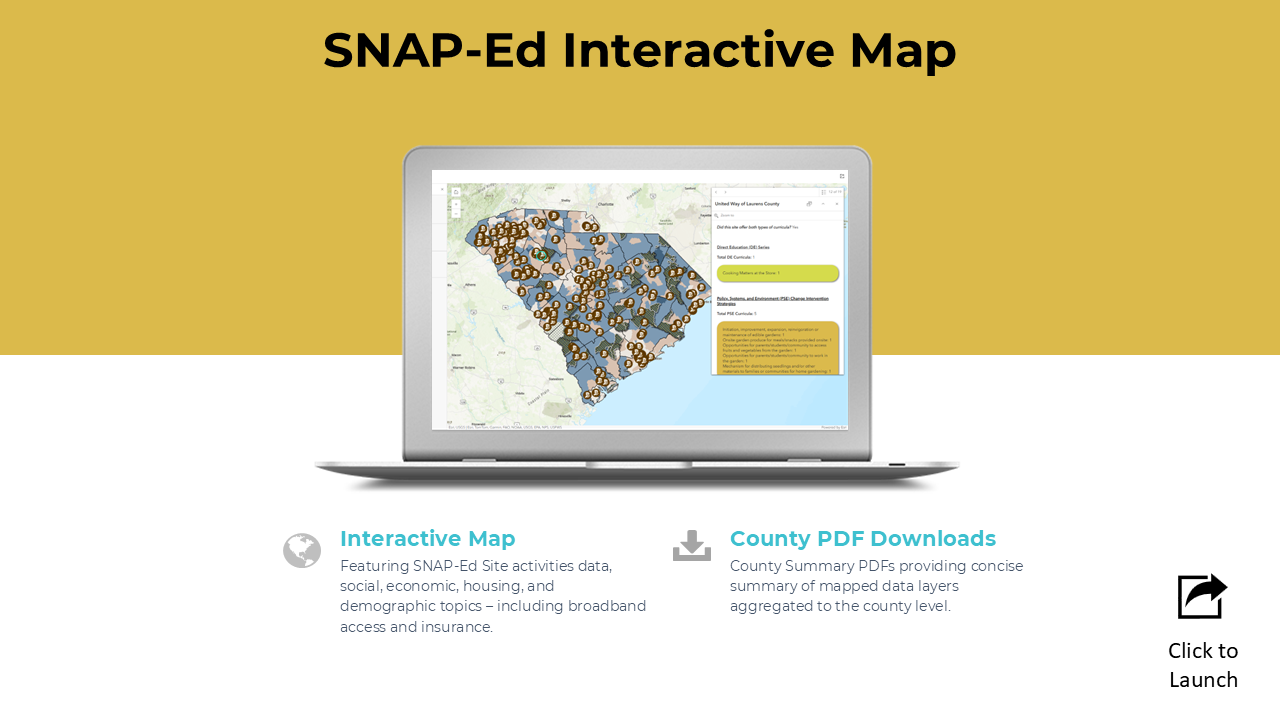
View the SNAP-Ed Interactive Map
Providing stakeholders with a planning tool that visualizes what's happening at the neighborhood level and the data needed to make data-driven decisions.
The SNAP-Ed Interactive Map displays geographic information at the Census Tract and County levels, featuring SNAP-Ed Site activities data, social, economic, housing, and demographic topics - including broadband access and health insurance coverage.
