SC HealthViz Findings

Dynamic Report Generator Added to Site

A new, dynamic report generator was added to the SC HealthViz site August, 2014. This new feature provides users the option to explore Medicaid claims data for fiscal years 2008-2014 by filtering along more than one parameter, such as exploring county-level data by plan type and a specific demographic (i.e., gender, age group, gender, qualifying category, and race).

Using the new interface, reports can be generated for Medicaid enrollment and for a number of primary benefits and services provided by the SC DHHS Medicaid agency. Reports for a single year and the state overall or a select county provide a snapshot with pie charts for all demographics; whereas, reports for multiple years, provide bar charts and line graphs. 

Screenshot of ring charts available for single year view


When multiple years and counties are selected, both stacked and grouped charts are generated. 

Screenshot showing chart options for multi-criteria query


Individual charts can be exported using the export feature, or the entire report can be printed. As new data are queried, the charts update along with the underlying data presented in the report table at the bottom of each page and in the hover text within the graphs. 

Screenshot of dashboard with print and export functions highlighted 

This new feature was used to generate the data needed to update the 2014 Quick Facts for both enrollment and benefits and services paid through June 30, 2014.    

SC Birth Outcomes Data Featured in Esri ARC-GIS Product Gallery

Collaboration results in "Briefing Book"

Pages from Esri Briefings Book

Recently, the Division of Medicaid Policy Research at the USC Institute for Families in Society collaborated with Esri to develop a “Briefing Book” application that features South Carolina Birth Outcomes Initiative data. The Briefing Book is a configuration of ArcGIS and a JavaScript application that allows users to view and create map-based briefings and reports with interactive content. The application can be deployed by local, state, and national governments; utilities, NGOs, as well as private industries; to create and deliver dynamic and interactive briefings and reports for executives, decision-makers, knowledge-workers, and constituents.

You can see the resulting product, as well as a Birth Outcomes Analysis template, also based on MPR's work on the ESRI site.


Mapping the Percentage of C-Sections in South Carolina

South Carolina Birth Outcomes Initiative at the South Carolina Department of Health and Human Services is partnering with the South Carolina Hospital Association, other state agencies, private providers, payors, consumers and advocacy groups in an effort to improve the health of moms and babies through the reduction of cesarean sections for first-time, low-risk mothers across the state. As this infographic shows, compared to some states, SC has a comparatively low rate of early scheduled deliveries, but there are still gains to be made

Nationally, there has been an increased focus on improving the quality and safety of perinatal care, which specifically addresses the increasing C-section rate across the country. On February 19, 2014, the American College of Obstetricians and the Society for Maternal-Fetal Medicine released new guidelines to reduce cesarean deliveries in first-time mothers. These guidelines suggest several potential approaches, including allowing women with low-risk pregnancies to spend more time in labor, to reduce the risk of having an unnecessary C-section and decrease the national cesarean rate.

About one-third of all births in the U.S. are done by C-section, and most of those are in first-time mothers. This is a 60 percent increase since the mid-1990s. The rapid increase in cesarean birth rates raises significant concern that cesarean delivery is overused without any significant improved maternal or newborn outcomes. The observed increase is likely to be multi-factorial and may be related to medical liability fears, increased use of labor inductions or patient/provider preference. Not only do C-sections add unnecessary costs into the health care system, the procedure can increase complications for the mother and raise risk during future pregnancies.

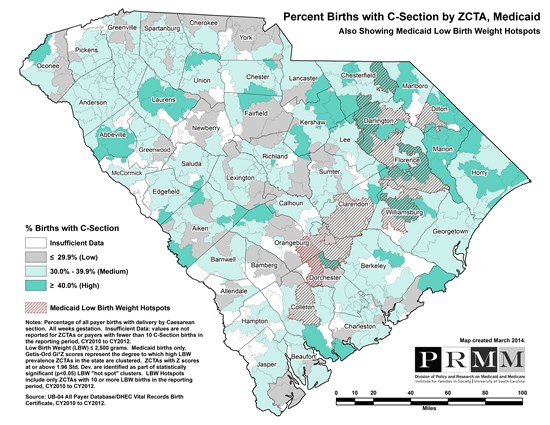
This map details the percentage of births with a C-Section by ZIP Code Tabulation Area (ZCTA) from Calendar Year 2010 to Calendar Year 2012. Areas shaded with the darker green color have a higher percentage of births with a C-Section than those with lighter green shading (medium percentage) or grey shading (low percentage). Areas with red horizontal lines represent low birthweight (LBW) hot spots, those with a significant clustering of high LBW.  


Click for a pdf of the map of Percent of Births with C-SectionsGet this map as a pdf

Gravatar

SC Medicaid Low Birth Weight Clusters

According to America’s Health Rankings (2013), 9.9% of South Carolina babies born in 2011 weighed less than 2,500 grams (5 pounds, 8 ounces).  The state ranks 47th nationally in percentage of low birth weight babies and received an "F" on last year’s March of Dimes Premature Birth Report Card. 

March of Dimes recognizes premature birth and fetal growth restriction as the two primary causes of low birth weight, which is associated with a number of newborn conditions, including respiratory distress syndrome, bleeding in the brain, patent ductus arteriosus, necrotizing enterocolitis, and retinopathy of prematurity.  Later in life, babies born with low birth weight may be more likely than babies born at normal weight to have high blood pressure, diabetes, and heart disease.

Download PDF

SC Medicaid Low Birth Weight Clusters, FY2011   

Page 2 of 2 << < 1 2