South Carolina Birth Outcomes Initiative at the South Carolina Department of Health and Human Services is partnering with the South Carolina Hospital Association, other state agencies, private providers, payors, consumers and advocacy groups in an effort to improve the health of moms and babies through the reduction of cesarean sections for first-time, low-risk mothers across the state. As this infographic shows, compared to some states, SC has a comparatively low rate of early scheduled deliveries, but there are still gains to be made
Nationally, there has been an increased focus on improving the quality and safety of perinatal care, which specifically addresses the increasing C-section rate across the country. On February 19, 2014, the American College of Obstetricians and the Society for Maternal-Fetal Medicine released new guidelines to reduce cesarean deliveries in first-time mothers. These guidelines suggest several potential approaches, including allowing women with low-risk pregnancies to spend more time in labor, to reduce the risk of having an unnecessary C-section and decrease the national cesarean rate.
About one-third of all births in the U.S. are done by C-section, and most of those are in first-time mothers. This is a 60 percent increase since the mid-1990s. The rapid increase in cesarean birth rates raises significant concern that cesarean delivery is overused without any significant improved maternal or newborn outcomes. The observed increase is likely to be multi-factorial and may be related to medical liability fears, increased use of labor inductions or patient/provider preference. Not only do C-sections add unnecessary costs into the health care system, the procedure can increase complications for the mother and raise risk during future pregnancies.
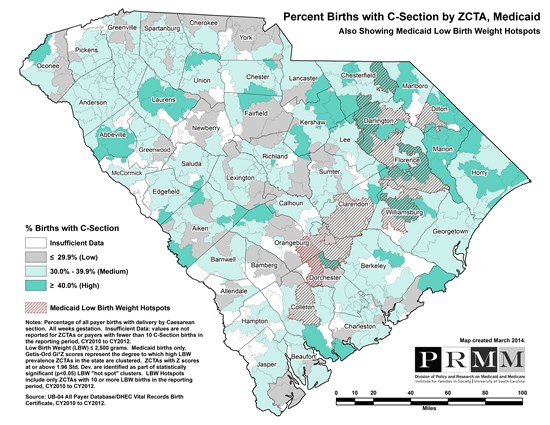
This map details the percentage of births with a C-Section by ZIP Code Tabulation Area (ZCTA) from Calendar Year 2010 to Calendar Year 2012. Areas shaded with the darker green color have a higher percentage of births with a C-Section than those with lighter green shading (medium percentage) or grey shading (low percentage). Areas with red horizontal lines represent low birthweight (LBW) hot spots, those with a significant clustering of high LBW.
 Get this map as a pdf.