A new, dynamic report generator was added to the SC HealthViz site August, 2014. This new feature provides users the option to explore Medicaid claims data for fiscal years 2008-2014 by filtering along more than one parameter, such as exploring county-level data by plan type and a specific demographic (i.e., gender, age group, gender, qualifying category, and race).
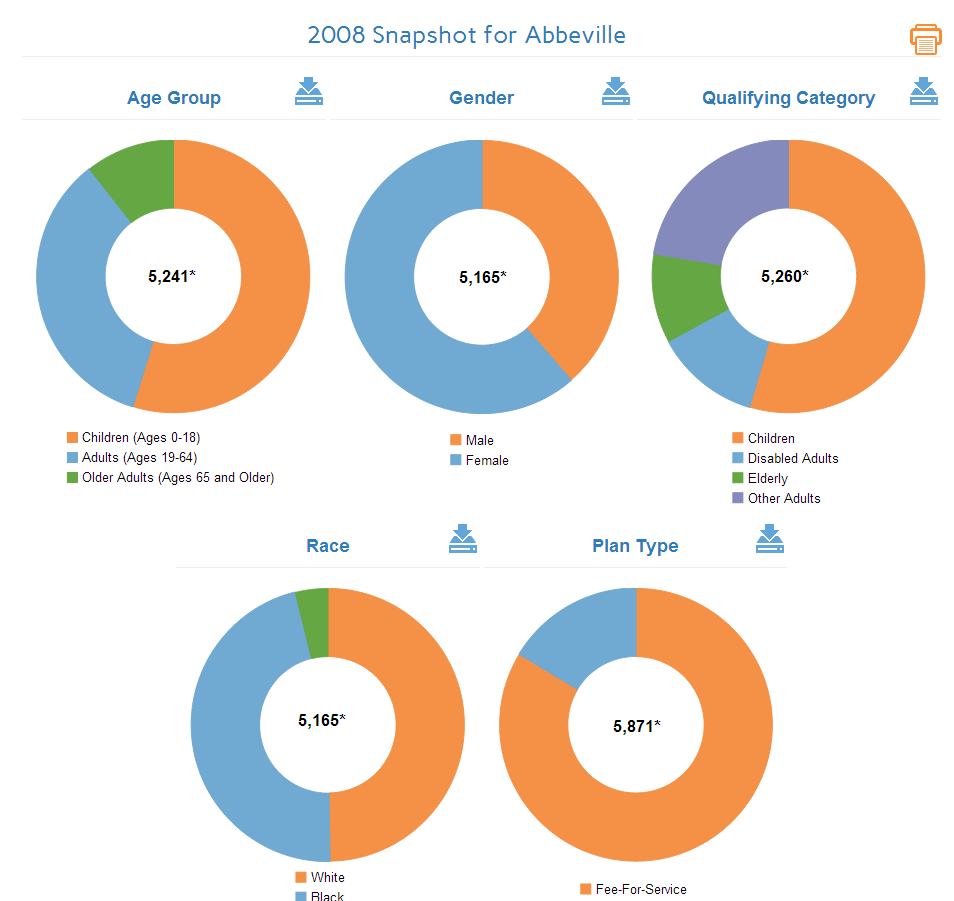
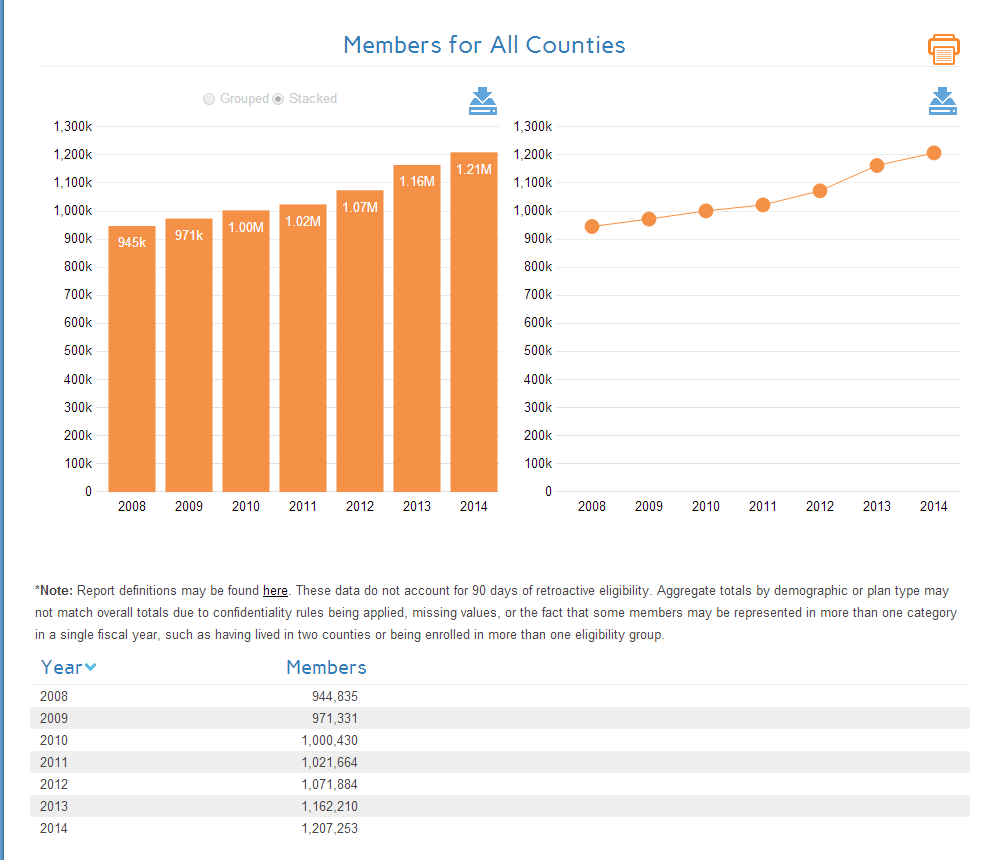
Using the new interface, reports can be generated for Medicaid enrollment and for a number of primary benefits and services provided by the SC DHHS Medicaid agency. Reports for a single year and the state overall or a select county provide a snapshot with pie charts for all demographics; whereas, reports for multiple years, provide bar charts and line graphs.

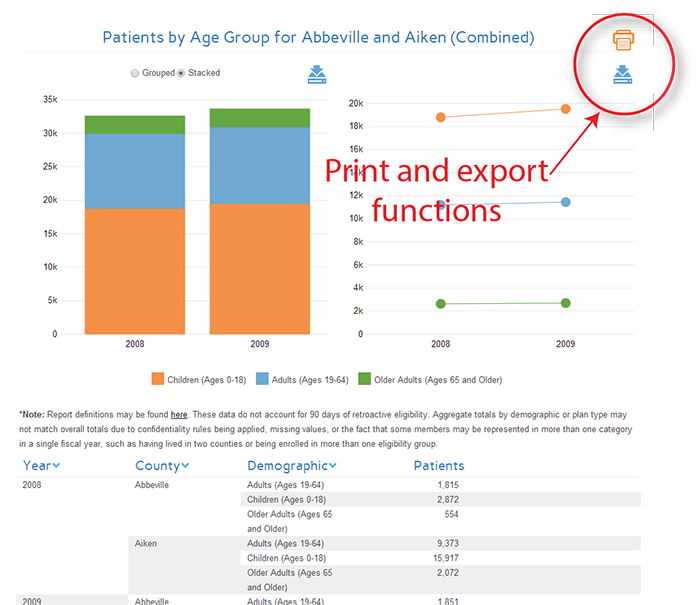
When multiple years and counties are selected, both stacked and grouped charts are generated.

Individual charts can be exported using the export feature, or the entire report can be printed. As new data are queried, the charts update along with the underlying data presented in the report table at the bottom of each page and in the hover text within the graphs.

This new feature was used to generate the data needed to update the 2014 Quick Facts for both enrollment and benefits and services paid through June 30, 2014.